
Application of H.O.S.T. map
Background
Information
Information
Although the display of three-dimensional (3D) terrain model is very convenient for users, the two-dimensional (2D) topographic map is still essential to plan and design for engineers in practice.
The traditional types of 2D topographic map include contour map, hypsometric map and 3D hillshade map as shown in Figure 1.
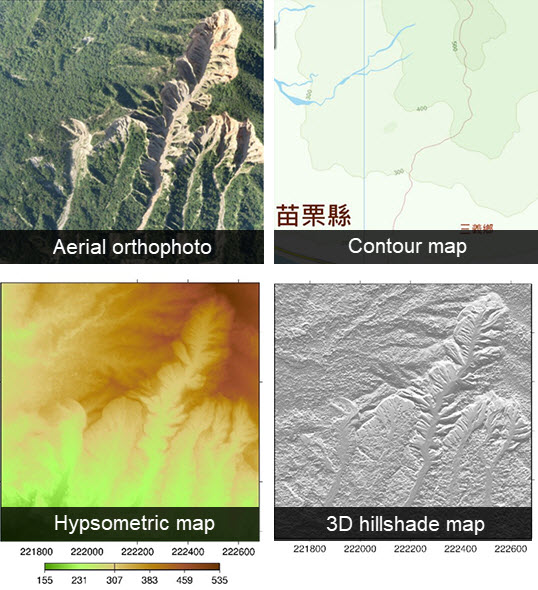
Figure 1. Common types of 2D topographic map
The inadequacies of traditional topographic maps
| Type | Advantages | Disadvantages |
|---|---|---|
| High resolution optical satellite images and orthophotos | More Visualized. |
|
| Contour map and hypsometric map | More suitable for wide-ranging display | Hard to recognize the microtopography of slope surface. |
| 3D hillshade map | The portion of terrain’s detail can be emphasized clearly. |
|
New topographic map
in the digital era
in the digital era
Recently, owing to high-resolution digital elevation model (DEM) is popular, some types of topographic map distinctly presenting the significant of microtopography have been developed, including the red relief map, the color shading map and the CS stereo map (CS立体図).
For the red relief map, it combines openness and slope; instead, the CS stereo map integrates curvature, slope and elevation. Besides, the color shading map is fused slope with specific direction of light.
Development process and
principles of H.O.S.T map
principles of H.O.S.T map
Under the funding of innovative research projects by Agency of Rural Development and Soil and Water Conservation (ARDSWC), professor Yu-Shen, Hsiao in National Chung Hsing University have developed H.O.S.T. map which integrates height, openness and slope in 3D visualized terrain map as shown in Figure 2.
The most significant differences between H.O.S.T. map and traditional red relief map are the estimating process and the clearer elevation information.
In H.O.S.T. map, the estimating processes of slope and openness have been improved. Besides, the elevation information has been considered to make the 3D palette.
Moreover, the Taiwan Invention Patent (No. I627602) for H.O.S.T. map has been granted and issued in June, 2018.
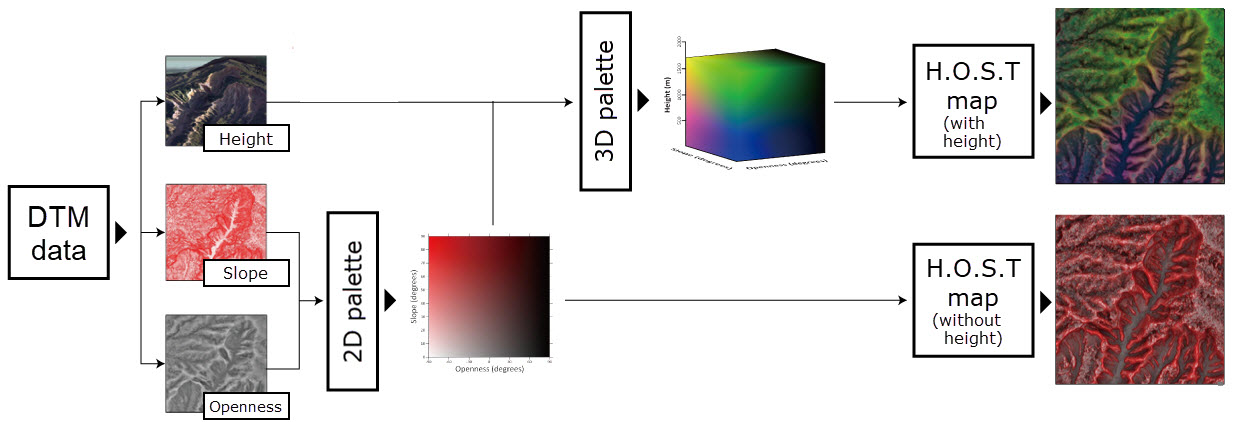
Figure 2. Principles for making H.O.S.T. map
2D palette of H.O.S.T. map
The 2D palette of H.O.S.T. map consists of slope and openness. Besides, the color distribution is referred to the research made by Chiba et al. (2008).
Moreover, the definition of openness is viewed as the accepting value of light. That is, the ridge has better openness because of larger accepting value of light. In contrast, the valley has worse openness because of smaller accepting value of light. Besides, the colors of openness from white to black mean the best openness to the worst one in the 2D palette as shown in Figure 3.
In addition, the color of steep slope is red in 2D palette. Instead, the color of gentle slope is white.
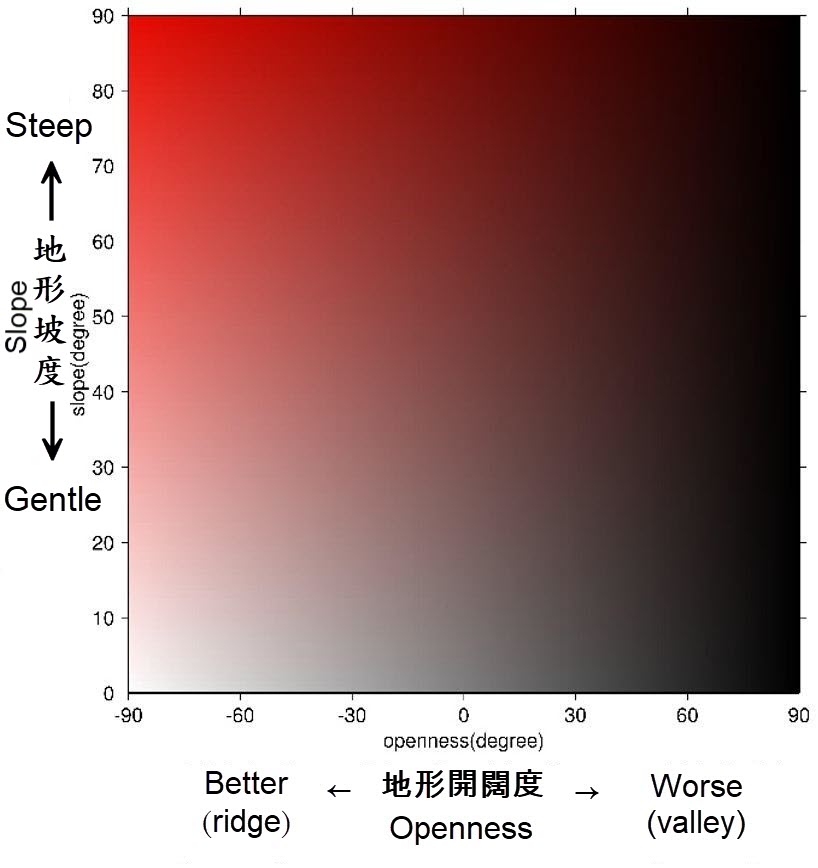
Figure 3. 2D palette of H.O.S.T. map
3D palette of H.O.S.T. map
Although the H.O.S.T. map made by 2D palette improves the disadvantages of hillshade map, the whole map will be too complicated to comprehend if the changes of height were overlaid. Hence, the 3D palette is created by combining 2D palette and the information of height. In the 3D palette, the new axis of z is assumed as the value of height. Furthermore, , the 3D palette represents the higher the terrain is, the greener the color of height changes. Instead, the color of lower part becomes blue. That is, the color transfers into purple at the red part in the 2D palette which means the terrain is steep and low. However, the color becomes yellow if the terrain is higher as shown in Figure 4.
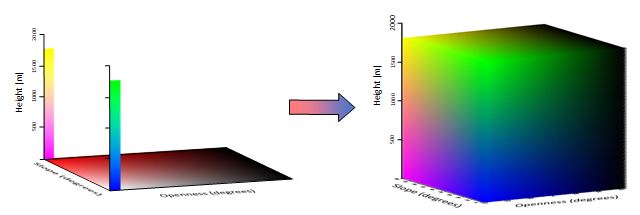
Figure 4. 3D palette of H.O.S.T. map
Advantages of H.O.S.T. map
In the past, the topographic map scale was 1:25000 and the high-resolution DEM made by airborne LIDAR have been demonstrated as contour maps usually. However, the contour maps can’t clearly display the changes of microtopography because of the low-resolution. Moreover, for the people who haven’t been trained, it’s hard to transfer the 2D contour maps into 3D terrain model intuitively. For the orthophoto taken by satellite, the terrain is also difficult to observe because of the covered plants.
Hence, the H.O.S.T. map has been developed to solve these disadvantages of traditional maps. According to the principles of H.O.S.T. map, it is much more stereoscopic than the traditional maps. Moreover, not only the terrain which covered by plants, but also the characteristics of microtopography can be observed directly by people who haven’t been trained. The comparisons of these maps are shown in Figure 5.
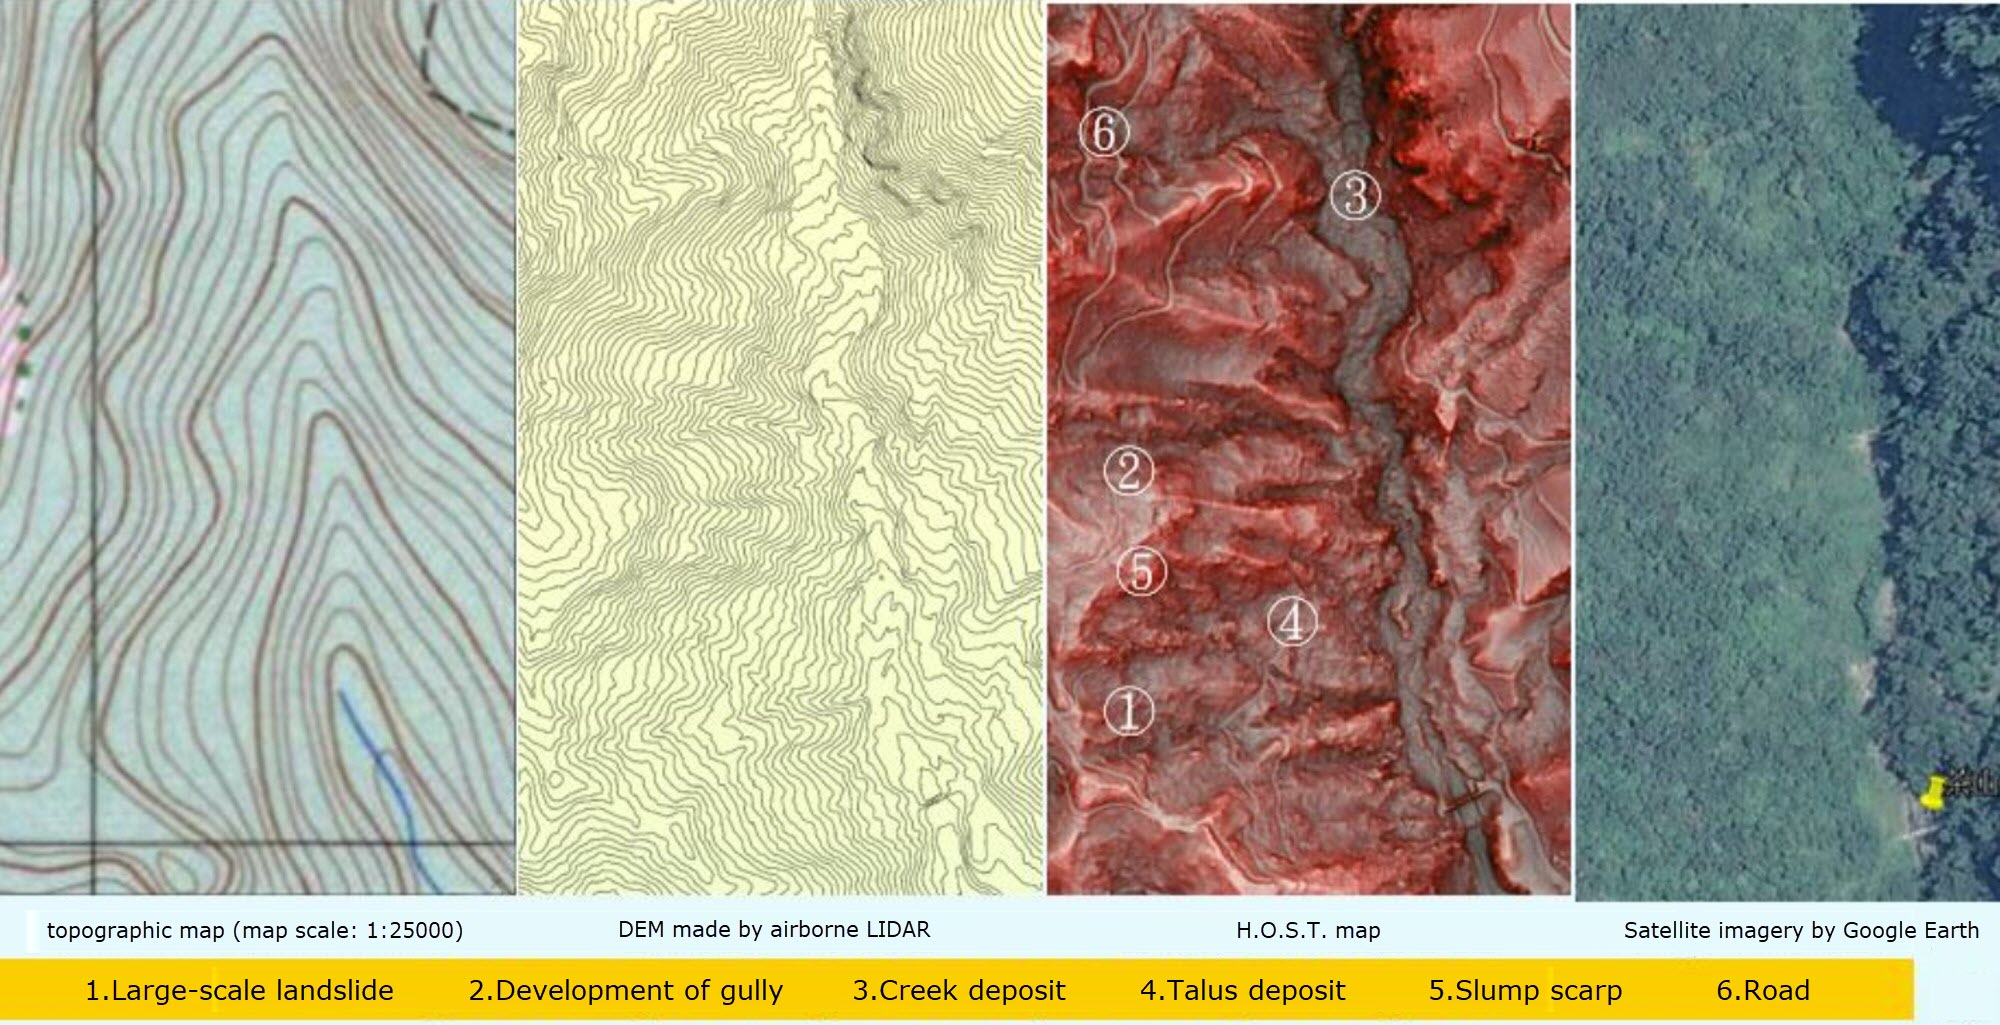
Figure 5. The comparisons of different maps in same place
Results of H.O.S.T. map
In Taiwan, H.O.S.T. maps and CS stereo maps have been produced using 20 m and 5m resolutions on BigGIS (https://gis.ardswc.gov.tw) by ARDSWC. On the system, users are free to switch the dual-window mode for comparing different maps. Besides, the simultaneously demonstrate function of 2D and 3D maps are provided as shown in Figure 6.
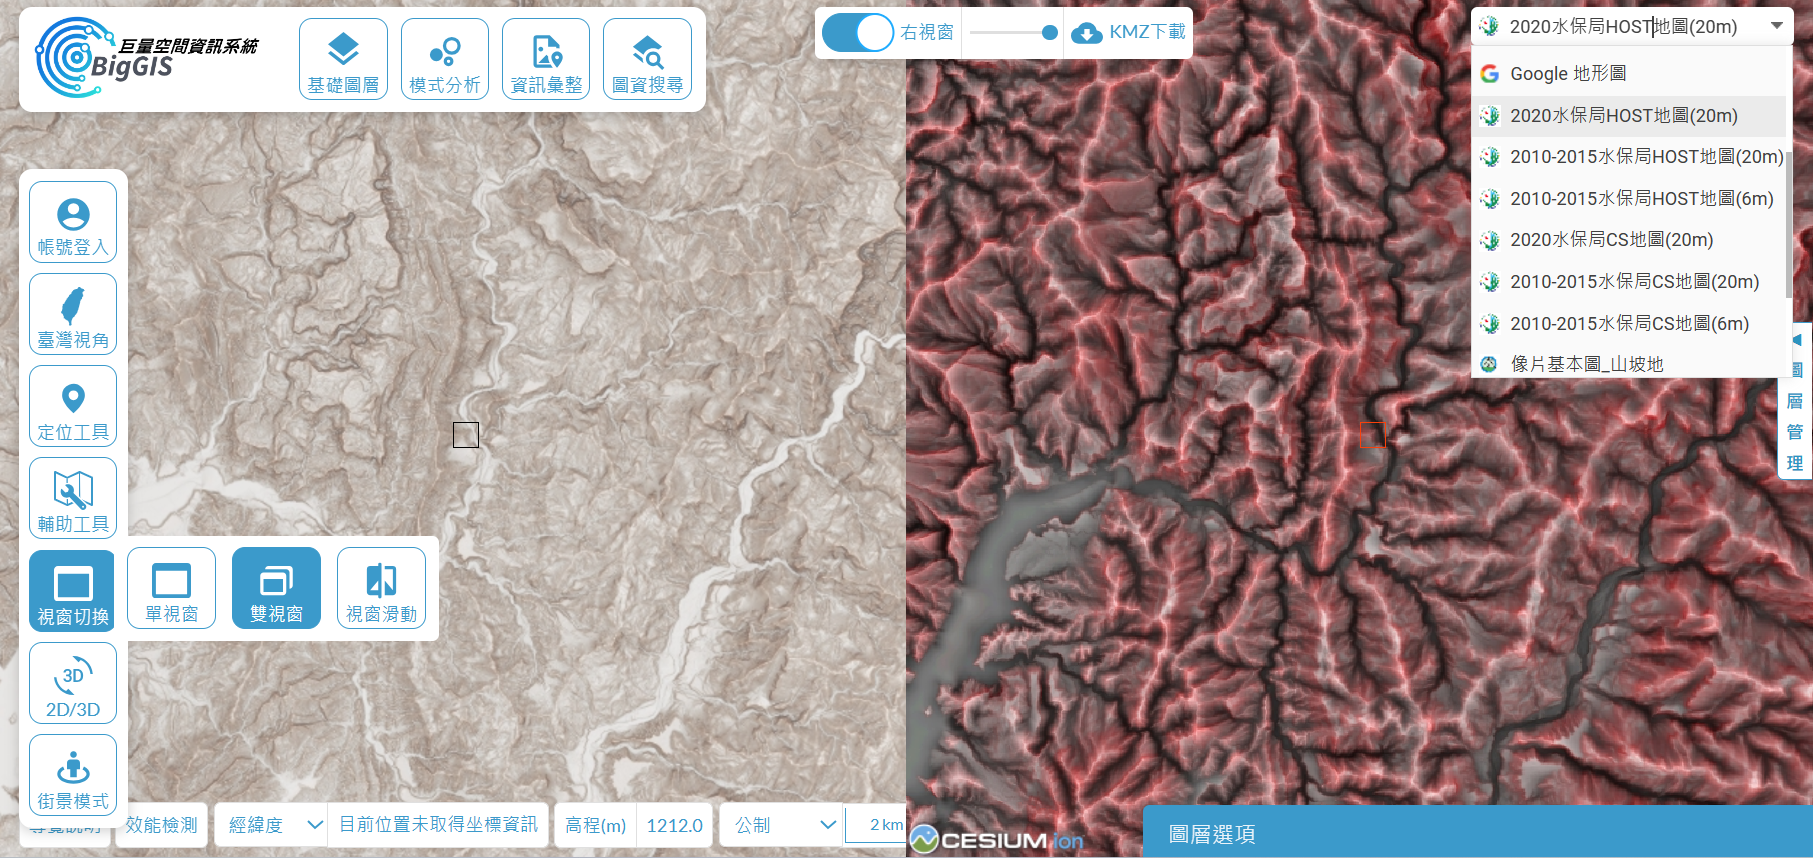
Figure 6. The results of H.O.S.T. map and CS stereo map